Polars is awesome!
I recently came across this excellent calmcode tutorial about polars and its write-up and I was intrigued. Time passed but I finally found the time to discover the library and I believe it is amazing! I am very enthousiatic about it for several reasons:
- It is really fast! It is so fast that it pushes the limits of what can be done in a local machine without access to a Spark cluster.
- The syntax, although it requires some effort in the beginning, is really intuitive. Actually, if you have prior pySpark or scala Spark experience which is not uncommon today, it is much easier to use it and quickly onboard.
- I found my code to be elegant! There is an easy way to do groupBy’s and join in a single line (check below) which is a time-saver!
In this post I show a quick demo with the AOL query dataset that can be obtained from kaggle. This not a huge dataset, ~3.6M lines in a tsv. Yet, it is enough to show some of the merits of polars. The AOL dataset consits of queries and clicked items from a few thousands of users. It is a well studied dataset in the field of information retrieval.
Here is how the data look like:
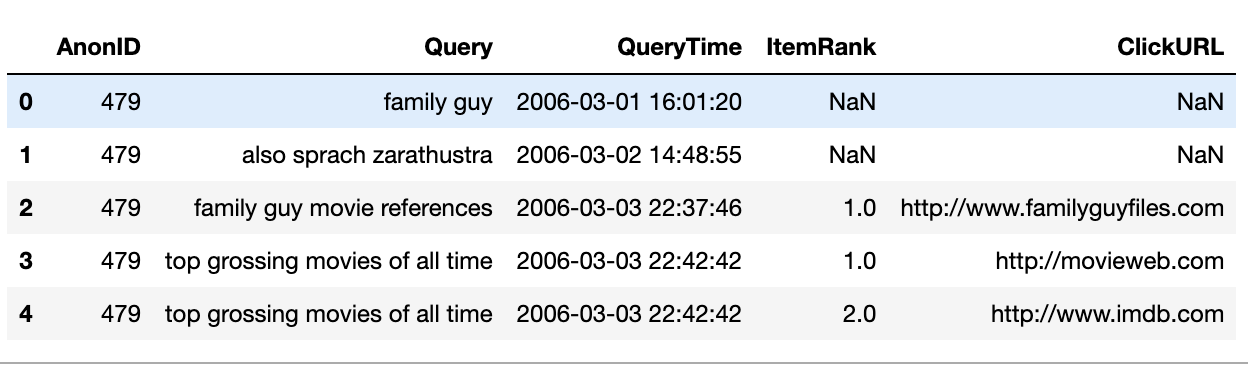 From the columns,
 AnonID is a user_id, and ItemRank and ClickURL are the position and the url of the clicked item when someone clicked (NaN otherwise). In this example, we see that user 479 issued few queries on the respective timestamps. For ‘family guy movie references’ they clicked on ‘http://www.familyguyfiles.com’ which was shown on the 1st position of the search results page.
Installation
Just to show how easy it is to install polars (and pandas if not there):
pip install polars pandas
Demo-Timings
I will illsutrate an initial feature generation pipeline, both with pandas and with polars and we will compare the timings.
After loading the data, we will extract some timeseries features (weekday, month) and some user prevalance stats (Number of queries and number of clicks a user did). Also, we will append a column on the data with the number of times a query occurs in the data. Typically, in pandas you would do groupBy and joins for such features.
Here we will do one groupBy with Named aggregations and we will also use transform to elegantly add columns to the dataframe. As a small parenthesis, pandas named aggregations are a very clean way to describe agrgegations, it is a feature I have grown to appreciate a lot.
Here is the pandas code:
df = pd.read_csv(path_to_data, delimiter="\t")  # Reads the data
df['QueryTime'] = pd.to_datetime(df['QueryTime'])  # Convert to time
per_user_queries = df.groupby("AnonID", as_index=False).agg(nbQueries=("Query", "count"), NbClicks=("ClickURL","count"))
df['month'] = df['QueryTime'].dt.month  # Time-series features
df['weekday'] = df['QueryTime'].dt.day_of_week  # Time series features
df = df.merge(per_user_queries, on=['AnonID'])  # Merge
df['QueryOccurencesInData'] = df.groupby('Query')['Query'].transform('size')  # Add frequency of a query
The result looks like:
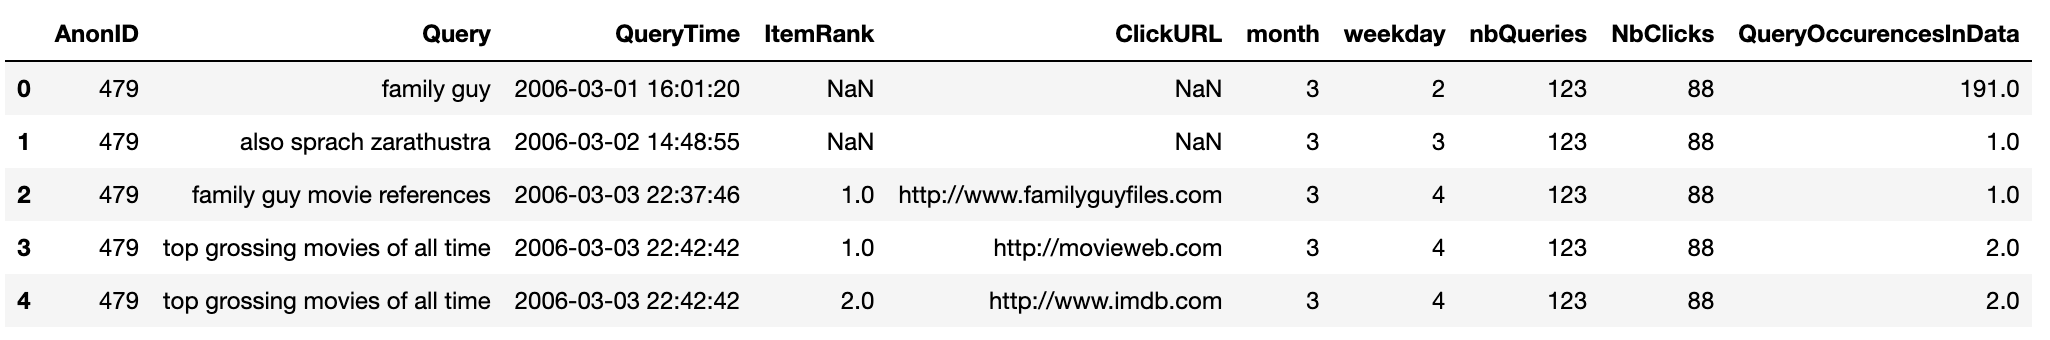 I like to believe that this is decent pandas code.To make it cleaner, I would user
 .pipe but here it is quite short. Running in an iMac n jupyter notebook and timing with %%time cell magic returns 6.5sec.
Here is the polars code:
df = pl.scan_csv(path_to_data, parse_dates=True, sep="\t")
df.select([
    pl.all(),
    pl.col('Query').count().over('AnonID').alias('nbQueries'),  # count queries
    pl.col('ClickURL').drop_nulls().count().over('AnonID').alias('PerUserCount'),  # count clicks
    pl.col('QueryTime').dt.month().alias("month"),  # Time-series features
    pl.col('QueryTime').dt.weekday().alias("weekday"),  # Time-series features
    pl.col('QueryTime').count().over('Query').alias("QueryOccurencesInData")  # Add frequency of a query
]).collect().limit(10)
The results looks like this:
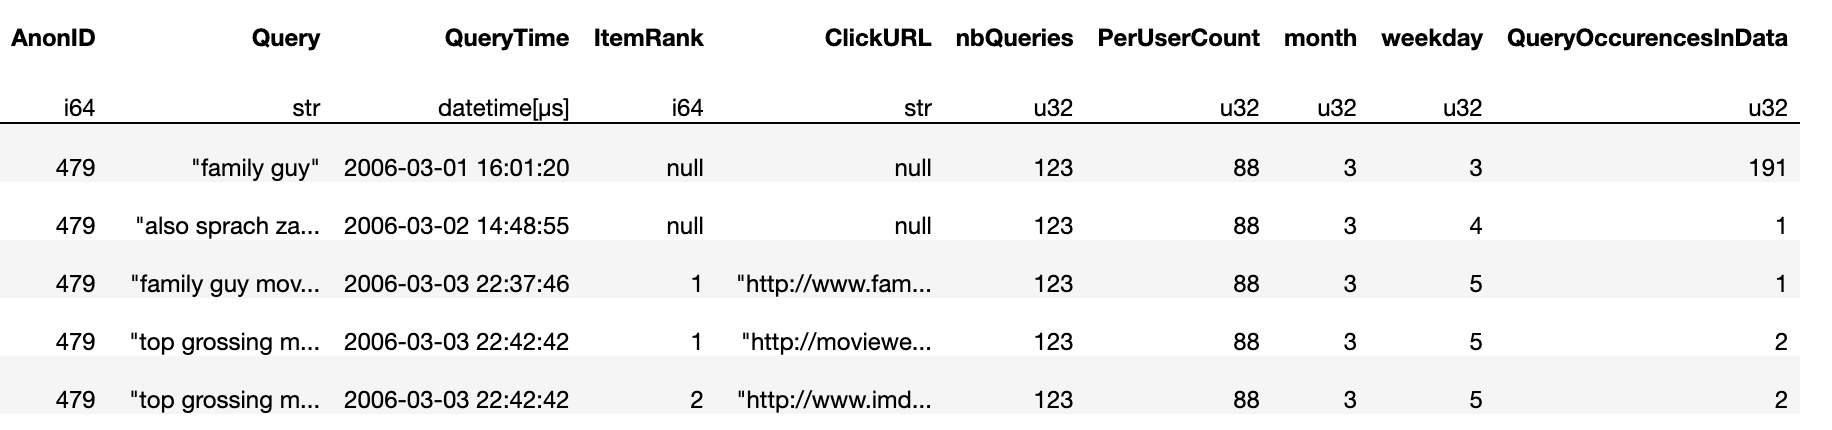 They both return identical results (except the day of week, which has a delta of 1). The difference is that the polars code takes 860ms!!! It is around 8x faster!
What is more, the syntax is really nice for my taste! The way select is used and the way window aggregations can do groupBy’s (look the use of
They both return identical results (except the day of week, which has a delta of 1). The difference is that the polars code takes 860ms!!! It is around 8x faster!
What is more, the syntax is really nice for my taste! The way select is used and the way window aggregations can do groupBy’s (look the use of .over) is very elegant! Notice, that all these aggregations are done within a single select and polars takes care of executing them embarassingly parallel!
Concluding thoughts
I loved it taking time with polars. I am very enthousiastic about it and I will start using the project more and more. As a matter of fast I used it with a dataset of ~20GB for work. Cleaning and feature generation took around 7 min.. With pandas, I had to split the jobs in smaller tasks with loops and the same task took more than an hour. So this is an actual 10x speed-up out-of-the-box that made my day.